
Background
Block Analitica and B.Protocol, partnering as risk curators, recently co-launched Flagship ETH and USDC Metamorpho Vaults on top of Morpho Blue.
There is a positive initial adoption of $20M in supply on the Flagship wstETH/WETH vault. While the vault size still doesn’t bring substantial economic risk at this point, a robust risk modeling methodology must be established as the market exposure continues to grow.
In this research report, we’re introducing the MetaMorpho Risk Model. It aims to estimate Capital at Risk (CaR), a portfolio-level estimation of potential bad debt based on stress-testing various market risk scenarios. More specifically, we simulate different scenario combinations of price shocks, liquidity, and protocol growth trajectories. Its key goal is to provide a simple-to-understand methodology with intuitive, actionable insights and add additional complexity over time. CaR can be further used to estimate Risk Premiums by comparing CaR with the vault’s total borrow amount.
As the current market size is difficult to use to extrapolate further growth, we are using Aave v3 Ethereum’s market as a proxy (based on specific filtered isolated positions) for MetaMorpho’s evolution over time. As the adoption of MetaMorpho grows, we will use it instead for modeling.
The main purpose of applying this model to MetaMorpho (which is also being used at SparkLend) is initially to validate the chosen LLTVs and simulate potential losses across different market risk scenarios. To approximate MetaMorpho’s design, we filter only the wallets with a single collateral asset, and single borrow asset positions (isolated market design). Additionally, it can be combined with B.Protocol’s SmartLTV formula which acts as a guardrail for the set risk parameters to make sure that MetaMorpho vault parameters optimize both transparently and autonomously on the growth and risk trade-off spectrum.
Important to mention is that the model (as any quantitative model) includes some subjective assumptions that can always be argued against. We intend to provide the underlying assumptions transparently, share our views based on industry experience over the years, and focus on a few questions that we identified as key to understanding the economic risk of MetaMorpho.
For example, the questions of “what kind of market shock should the protocol be protected against” or “what kind of protocol losses are the users and/or token holders willing to tolerate” have no objective value, especially when considering also the aim of optimizing protocol growth by increasing capital efficiency.
Among other examples is also the difficulty in estimating the negative long-term consequences of different bad debt events on protocol growth. For this reason, we chose to model market dynamics that fall within the quantifiable known-unknowns territory.
Methodology
In DeFi lending context, slippage indicates how much loan exposure can be profitably liquidated onchain. The drainage of available liquidity introduces the risk of protocol losses (bad debt). Bad debt arises when the debt amount is higher than the collateral amount with neither incentive nor possible enforcement for the user to repay their debt. This guides the setup and output of the risk model.
The model takes the current Aave v3 Ethereum wallet positions, filtered on the approximated isolated market design (single collateral asset, single borrow asset). It applies the current LLTVs (margin requirements) of MetaMorpho with the assumption that the users either increase the borrow (in case of a higher LLTV at MetaMorpho compared to Aave) or decrease the borrow (in case of lower LLTV at MetaMorpho compared to Aave) to maintain the same liquidation safety buffer (health rate). This is used as input to simulate Liquidations at Risk, Capital at Risk (bad debt), and Risk Premiums (CaR over total borrow amount).
The model simulates a specific instant price shock (currently set at 40% for volatile assets and 10% for pegged assets) to simulate its output. This simulates the shock velocity during which position owners don’t have time to respond, including positions managed with bots, an assumption set intentionally conservatively.
A single number interprets the results and provides clear guidance (“the protocol is protected against an X% price shock”). The instant price shock is used because, in the case of a gradual price decrease, users are likely to respond where some portion of the debt is saved. Also, in that case, individual positions trigger multiple smaller liquidation chunks which are unlikely to cause bad debt, unless there is a major drainage of the market’s liquidity causing a liquidation spiral. The model is meant to be a high-level guidance on the parameter setting, aiming for simplicity, and can be extended in complexity over time if necessary.
To estimate liquidity available for liquidations we use profitable DEX liquidity. This is computed by retrieving liquidity at 50% of the collateral asset’s liquidation bonus to add a conservative assumption of liquidation profitability. Wallets are liquidated based on size, offloading the available liquidity with 50% of the borrow position size liquidated. When all of the liquidity is drained, the remaining wallets are not liquidated in the simulations with the potential to directly contribute to bad debt (if the price shock is sufficient given their health rate). This will be further adjusted over time to get closer to both MetaMorpho’s design and also empirical data.
To sweep across various scenarios and their impact on CaR (bad debt), the model can iterate over different scenarios of supply growth, liquidity changes, and price shocks.
Supply growth scenarios show the relationship between protocol growth and bad debt and can inform how much exposure is governance willing to take on without being at risk of large losses. Supply growth iterates over the multiples of the current market state, from the current state to 10x of its size.
Liquidity changes are a function of market expansion/contraction (among other factors) and play a crucial role in how much liquidation volume can the ecosystem handle during various stress-testing events. As a rule of thumb, empirical data shows that each 10% increase in asset price increases DEX liquidity by 5% (2:1 relationship). This can be useful to imagine how different market trajectories can impact liquidity constraints.
Simulated price shocks test whether the health rate buffers are sufficient and if not, positions are liquidated, assuming enough market liquidity.
We also tested other price shock scenarios in the past (e.g. jump diffusion GBM), some of them being potentially a better representation of price trajectories. Meanwhile, we acknowledged that the subjectivity of inputs is not solved, it mostly becomes more hidden and less intuitive to interpret.
Additionally, the model can apply a jump multiplier by increasing or decreasing the baseline (ETH) price shock. For example, the price shocks of WBTC (if added to the portfolio) have been historically less severe than ETH while most long-tail assets showed more sensitivity to general market shocks.
Supply growth simulates a proportional increase in the market size. While the identical composition of position states with protocol growth is unlikely to play out exactly, we preferred this scenario modeling choice over adding more behavioral assumptions. This can, along with the other parts of the model setup, change if necessary.
Analysis
In the current setup of the MetaMorpho vaults, the focus is on wstETH as a collateral asset with WETH and USDC as borrow assets.
With WETH in borrow, the market risk comes from pegged asset price shock while USDC poses mostly a volatile asset price shock. The simulated LLTV of wstETH:WETH is 94.5% based on the current setup of Flagship ETH vault and the simulated LLTV of wstETH:USDC is 86%.
The chart below shows profitable liquidity for each type of market risk. As mentioned in the previous section, profitable liquidity is derived as liquidity at 50% of the liquidation bonus level (e.g. 5% of liquidation bonus looks at DEX liquidity at 2.5% slippage). The haircut on profitability is applied as a conservative assumption of both the effect of decreased liquidity during market shocks with other protocols also draining market liquidity due to loan liquidations. Also, in the simulation results when iterating over liquidity change, the default price shocks are applied (40% for volatile asset market risk, 10% for pegged asset market risk).
To reiterate, Aave v3 Ethereum is used as a proxy to gather feedback on our methodology and results while MetaMorpho’s empirical data will be used with increasing adoption.

Each MetaMorpho vault (using Aave v3 Ethereum as a proxy market state) includes the following sections:
- Market Size (filtered wallets based on the largest borrow asset)
- Health Rate Distribution (how close to liquidations are filtered wallets)
- Simulation Results - Liquidations at Risk wrt Liquidity Change (liquidated amount at risk as a function of supply amount and liquidity changes)
- Simulation Results - Capital at Risk wrt Liquidity Change (bad debt as a function of supply amount and liquidity changes)
- Simulation Results - Capital at Risk wrt Price Shock Change (bad debt as a function of supply amount and price shock changes)
- Simulation Results - Risk Premium wrt Price Shock Change (risk premium as a function of supply amount and price shocks changes)
wstETH:WETH
Market Size
As mentioned, wstETH:WETH vault poses pegged asset market risk.
153 wallets have wstETH:WETH in their wallet position with a total supply amount of $366M and $305M in borrow amount.
Market Collateralization
The chart below shows that almost the entire borrow amount has a health rate lower than 1.2 which is expected given that these are recursive LST positions. As an example, the largest wallet contributes $62M in borrow amount.

Simulation - Liquidations at Risk (wrt Liquidity Change)
The chart below simulates both a change in liquidity and an increase in supply (starting from the current state) with increments of 2x, 3x…up to 10x of the current market size.
The current liquidity conditions can be found at the level where Liquidity Change is at 0%.
Liquidations at Risk are capped at the available profitable liquidity, the unprofitable liquidations turn into bad debt with a sufficient price shock.
We see that almost all of the liquidity is drained from the market with the extreme stress test (default 10% pegged asset shock) that is simulated given the growing market size. This causes remaining under-collateralized wallets to contribute to bad debt which is shown in the next chart.

Simulation - Capital at Risk (wrt Liquidity Change)
Simulation of bad debt shows that protocol losses are determined largely by an increase in the market size (y-axis changes), much less so based on the profitable liquidity (x-axis changes).
If MetaMorpho’s vault size was at the current Aave v3 Ethereum’s market size ($366M in supply), with no change in liquidity and the applied extreme stress test, the market (simulated vault states) would most likely not cause bad debt. That increases with the increase of supply (x-axis changes) with the 10x increase in market size potential causing a loss of close to $10M.

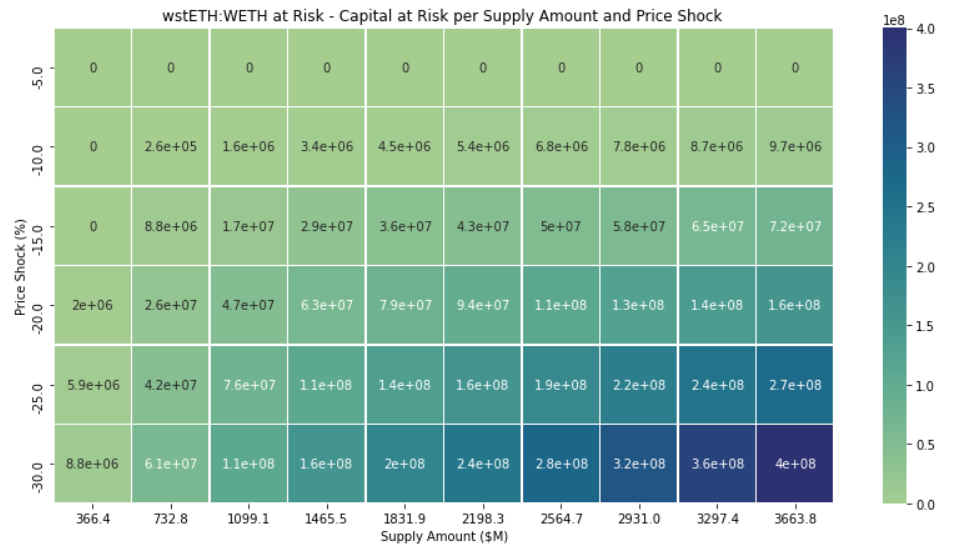
Simulation - Capital at Risk (wrt Price Shock)
Similarly to the above chart, the heatmap below shows an increase in Capital at Risk as a function of an increase in supply amount and price shock percentage.
While there’s no simulated loss at a 5% depeg event, that grows rapidly after a 20% depeg percentage, especially with the increase of the market size (up to $400M with a 30% depeg percentage and $3.7B in market size).
Meanwhile, the assumption in the simulation below is that the liquidity remains the same compared to the current state.
Simulation - Risk Premium (wrt Price Shock)
Risk Premium (RP) compares estimated CaR with total borrow amount. The heatmap below shows an increase in Risk Premiums as a function of an increase in supply amount and price shock percentage.
RP values range from 0% at 5% depeg level up to 13% at a 30% depeg level.
Meanwhile, the assumption in the simulation below is that the liquidity remains the same compared to the current state.

wstETH:USDC
Market Size
The wstETH:USDC pair poses market risk via the volatile asset market shock.
133 wallets have wstETH:USDC in their wallet position with a total supply amount of $117M and $43M in borrow amount.
Market Collateralization
The chart below shows that the borrow amount is more spread across different health rates with the largest 5 wallets contributing to more than half of total borrow.

Simulation - Liquidations at Risk (wrt Liquidity Change)
The chart below simulates both a change in liquidity and an increase in supply (starting from the current state) with increments of 2x, 3x…up to 10x of the current market size.
The current liquidity conditions can be found at the level where Liquidity Change is at 0%.
Liquidations at Risk are capped at the available profitable liquidity, the unprofitable liquidations turn into bad debt with a sufficient price shock.
We see that almost all of the liquidity is drained from the market with the extreme stress test (default 40% general price shock) that is simulated given the growing market size. This causes remaining under-collateralized wallets to contribute to bad debt which is shown in the next chart.

Simulation - Capital at Risk (wrt Liquidity Change)
At the current market size, with no change in liquidity and the applied extreme stress test, the market (simulated vault states) is unlikely to experience some loss. That increases with the increase of supply (x-axis changes), decreasing the liquidity significantly (-40%), and increasing the market size 10x where the potential loss is at $4.2M.

Simulation - Capital at Risk (wrt Price Shock)
The heatmap below shows an increase in Capital at Risk as a function of an increase in supply amount and price shock percentage.
While there’s no simulated loss at a 20% price shock, that grows rapidly after a 50% price shock percentage, especially with the increase of the market size (up to $27M with a 60% price shock percentage and $1.2B in market size).
Meanwhile, the assumption in the simulation below is that the liquidity remains the same compared to the current state.

Simulation - Risk Premium (wrt Price Shock)
Risk Premium (RP) compares estimated CaR with total borrow amount. The heatmap below shows an increase in Risk Premiums as a function of an increase in supply amount and price shock percentage.
RP values range from 0% at a 10% price shock level up to 6.4% at a 60% price shock with a $1.2B in market size (10x increase from current state).
Meanwhile, the assumption in the simulation below is that the liquidity remains the same compared to the current state.

Conclusion
The modeling framework presented above is a simple representation of the stress-tested scenarios of the MetaMorpho market risk. It is starting point from which we can continue building a more sophisticated methodology as necessary. Meanwhile, it can already be used as a worst-case scenario that MetaMorpho vaults could experience if the usage would approximate Aave v3 Ethereum’s market dynamics.
In the current form, it is not meant to be used in isolation as a standalone product but rather as a complement to B.Protocol’s SmartLTV formula which acts as a guardrail for set risk parameters (ie. LLTVs).
The CaR at the chosen default price shocks (on wstETH chosen 40% for volatile asset shocks, 10% for pegged asset shocks) shows a minimal market risk of the set LLTVs even with an order of magnitude increase in the market size. That changes with increased liquidity constraints and larger price shocks. Additionally, pegged asset risk (wstETH:WETH) poses larger risk than volatile asset risk (wstETH:USDC), also explained by the larger borrow size ($305M vs. $43M).
We will continue monitoring both the user behavior and market conditions and surface potential risks as necessary. As of future work, the model can also be applied to compute risk metrics mentioned above across different LLTVs.
It’s crucial to reiterate that these figures don’t represent a likely loss, more of a guidance given a certain market shock, meant also to open the question of both what kind of shocks the protocol needs to be protected against and also what kind of losses would still have a minimal impact on MetaMorpho’s long-term adoption. Both of these questions can further inform the setting of risk parameters to further optimize the protocol’s growth.